
When the Relationships in Data Are More Important Than the Data Itself
Neo Technology's Emil Eifrem takes a closer look at the Panama Papers -- and how a powerful graph database made the mining of such huge data files possible.
- By Emil Eifrem
- February 13, 2017
The now-infamous Panama Papers (made up of 11.5 million files leaked from the database of the offshore law firm Mossack Fonesca) created one of the biggest news scoops ever -- but without the enormous power of graph database technology, mining the data would have taken years.
The Panama Papers exposed the tax accounts of some of the world's richest, most powerful, and influential people, including politicians and world leaders. The data records were obtained from an anonymous source by the German newspaper Süddeutsche Zeitung. The International Consortium of Investigative Journalists (IICJ) then shared them with international news partners, including the BBC.
The Scale of the Challenge
The files were vast -- 2.6 terabytes of data and 11.5 million documents, including 4.8 million emails, covering nearly 40 years from 1977 up to the end of 2015. They listed over 200,000 companies registered in a range of tax havens. For example, the British Virgin Islands alone held more than 100,000 companies. The structure of the records was complex because Panama-based Mossack Fonesca didn't always communicate directly with these companies. Often it acted as an intermediary, taking instructions from banks, lawyers, accountants, and trust companies.
To put the scale into perspective, the investigation was carried out by the ICIJ with a network of more than 400 reporters from 80 countries who analyzed the data in secret for a year. As part of its findings, the ICIJ also released a searchable database of 300,000 entities it cherry-picked from the Panama Papers and its earlier Offshore Leaks investigation.
In some scientific fields, 2.6 TB of data would not be seen as anything but the norm, but for journalists such an intricate maze of files -- made up of documents, emails, PDFs, and images -- is enormous.
The ICIJ needed to focus on the relationships in the data. Without these connections it was almost impossible to connect the dots to create a picture.
Mining the gargantuan data set was made possible using graph database technology from Neo4j. It enabled reporters to discover relationships between accounts and account holders by visually inspecting the relationships -- the connections between documents -- and extracting their value. [Editor's note: The author is the cofounder and CEO of the company that created Neo4j.]
Nontechnical Reporters Used Graph Technology to Find Patterns
It may surprise you to learn that the data wasn't sifted and harvested by experienced data scientists but by a network of reporters who would not describe themselves as technical.
Using Neo4j, ICIJ reporters were able to discern patterns and spot trends that weren't visible before. They found relationships in the files that they had missed when viewing them individually.
According to Mar Cabra, head of the data and research unit at the ICIJ, "It wasn't until we picked up [graph database technology] that we started to really grasp the potential of the data. The reaction we started to get from colleagues when we put the data there? 'Oh my God, this is magic!'"
Some relationships could be directly inferred from the documents, while other relationships could be inferred by analyzing email records. If the ICIJ saw several emails between a person and a company, for example, it could infer that the person is a client of that company. Using similar logic, the ICIJ was able to create relationships in the graph database between entities that shared the same address, had family ties or business relationships, or that regularly communicated.
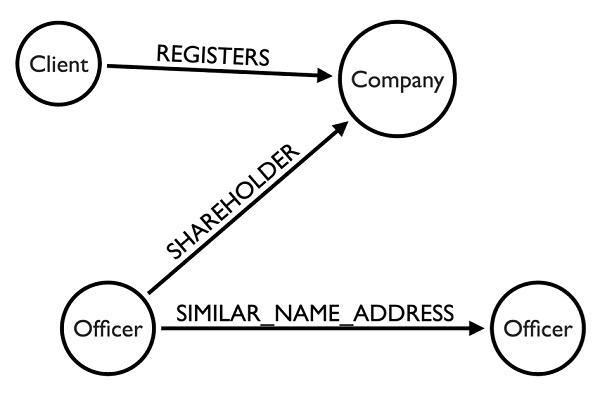
Figure 1: The graph data model used by the ICIJ
By their nature, these relationships were hidden and implicit, and connections often had to be traced back for the full picture to emerge. For example, the ICIJ uncovered Vladimir Putin's friend -- a cellist called Sergei Roldugin -- at the center of a scheme in which money from Russian state banks was hidden offshore. Some of it ended up in the ski resort used by Putin's daughter Katerina for her marriage venue. In another case, a prominent Icelandic politician was found to be co-owner of a company set up in the British Virgin Islands to hold investments he made -- a fact he had never disclosed.
Cabra has outlined how The Times of London quickly found a story in the Panama Papers about Emma Watson (the Harry Potter actress) purchasing a house through an offshore account. The association was revealed by unpicking hidden connections that manually would have taken an inordinately long time.
Clearly, use of better tools is the key to such breakthroughs. When ICIJ investigated its first big offshore financial story in 2012, the team tried to find such links by hand as best they could, drawing lines as they spotted relationships in simple Word documents.
Why Graph Technology Matters
Many commentators ask why workhorse data techniques such as relational and SQL were not used for the Panama Papers. The reason is that a high-volume, highly linked data set such as the Panama Papers is just too hard for SQL to parse.
Relational databases only model data as a set of tables and columns, carrying out complex joins and self-joins when the data set becomes more interrelated. Such queries are technically tricky to construct and expensive to run, while making them work synchronously is not easy, with performance faltering as the total data set size increases. Finally, the tabular data model is hard to understand and doesn't match the developer's mental visualization of the application (technically defined as "object-relational impedance mismatch").
As humans, we tend to create intuitive models by drawing connections between data elements; attempting to take a data model based on relationships and forcing it into a tabular framework, the way an RDBMS asks us to, creates a mental disconnect. By contrast, the power of graph database technology is in discovering relationships between data points and understanding them at huge scale.
That's because graph databases store data in structures made up of nodes, properties, and relationships, unlike traditional relational databases, which store the information in rigid tables. Graph databases then map the links between entities. The ICIJ's database ended up having 950,000 nodes and 1.2 million relationships.
The Future of Mining Big Data
Graph databases will take the spotlight when it comes to the Internet of Things (IoT) when billons of connected devices produce petabytes of data. Market analyst Gartner is predicting that by 2020 there will be 20.8 billion connected IoT devices around the globe.
Graph databases will enable enterprises to mine this data, pulling out relationship connections that data warehouses and relational databases just can't find.
Understanding the connections within IoT data will be important for understanding device dependencies and analyzing the data that will inform important business decisions. Enterprises will need a tool that can do this quickly and easily -- and this is where graph databases come in. They can discover, capture, and make sense of complex interdependencies and relationships with precision and high performance, turning them into real business value.
All too often we read about the big data mountains that are being created and how enterprises are going to scale them. The connections within this data are often forgotten. In reality, to extract valuable insight, the relationships in the data are far more valuable than the data itself.
About the Author
Emil Eifrem is CEO and co-founder of Neo Technology, the company behind Neo4j, a leading graph database.
Previously CTO of Sweden’s Windh AB, where he headed the development of highly complex information architectures for enterprise content management systems, Emil famously sketched out what today is known as the property graph model on a flight to Mumbai in 2000. Since then, Emil has devoted his professional life to building and evangelizing graph databases. He is a frequent conference speaker and a well-known author and blogger about NoSQL and graph databases as well as co-author of O'reilly's Graph Databases.