Should a Graph Database Be in Your Next Data Warehouse Stack?
As interest grows in new technologies, many enterprises are reconsidering their data warehouses. What makes graph databases different from traditional RDBMSs?
- By Steve Sarsfield
- May 28, 2019
Data warehouses continue to be valuable for providing analytics for a wide range of use cases. However, as new technologies come of age and older technologies fade, there is often pressure among IT teams to modernize. Case in point: IBM recently announced that Netezza, a popular technology for data warehousing, will be deprecated in 2019. With vendor pressure and the emergence of newer, cheaper technologies, administrators are taking a new look at the data warehouse.
Today's trend is for companies to consider new deployment options such as the cloud, new licensing models such as subscriptions and open source, and even new paradigms for analyzing data that can save time and resources. You may be among the many who are completely rethinking your data warehouse or using different in-house technologies to tackle the task. Why are graph databases being considered in the mix of what has traditionally been RDBMSs only?
Inside a Graph Database
In a typical data warehouse scenario using a RDBMS, you store your data in tables. For example, you might have customer information in one database table, the items you offer in another, and the sales that you've made in a third table. This is fine when you want to understand items sold, current inventory, and who your best customer is. What's missing are the connections between the items, along with functions in the database that can let you make the most of them.
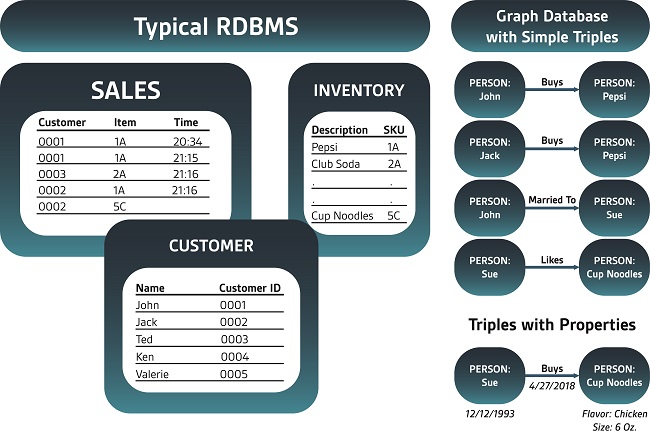
A graph database stores the same sort of data but in a non-tabular, just-the-facts way. The easiest way to think about it is that graph databases store facts such as: John bought Pepsi. John is married to Sue. John lives in Dallas. Pepsi is a beverage. John is a male person. Sue is a female person. Any fact, at any time, in any order. Your queries can then discover whether married people from Dallas are more likely to buy Pepsi than singles, and it can do so using relatively simple syntax without expensive JOINs. Graphs can easily understand the top influential Pepsi buyers and leverage other graph algorithms to better understand customers.
To make things even more powerful, labels on the facts (you may have heard of Labeled Property Graphs) give you further details. For example, you can easily specify using properties that Sue bought Cup of Noodles (fact) on April 27, 2018, at 11:37 a.m. (property). The stored facts and properties form a matrix of connected and unconnected information that you can explore and view from different angles. It may sound simplistic, but there are some advantages.
Simplified Metadata Management
Some analytics teams have little time to manage schemas for incoming data. They are given data and asked to produce analytics from it. Handling schemas and potential changes can be a time-consuming challenge. NoSQL databases have become popular for their ease-of-use due to their flexible schemas. However, graph databases and the power of triples can also simplify metadata management. By configuring all your data into triples, you limit your need to set up rigid schemas, complicated ETL, and data transformation.
Because everything is in one table as facts and properties, graphs free you from having to do JOINs, for example, to understand how to market to each individual customer. You can see the relationships in the data without having to make a hypothesis and test it. Make a knowledge graph and explore your data.
Further, a key component of master data management (MDM) is to supply meaningful views of disparate data. The fact/property underpinnings of graph databases are designed to optimize those views. You can easily model both hierarchical and nonhierarchical master data in a graph, making it easier than an RDBMS for visualizing data relationships.
Experts such as Aaron Zornes agree. Graph databases have traditionally not been considered for MDM because most of the early graph database vendors focused on transactional systems (OLTP) and couldn't scale for analytics. Recently, graph online analytical processing (OLAP) solutions have hit the market, making it possible to perform MDM in a graph database.
All the Analytics Plus Graph and Inferencing
Graph databases can commonly do all the analytics that a RDBMS can do, including aggregates such as count, average, min/max, ORDER BY, and offset functions on strings, numeric, dates, and times. In fact, you can even run standard database industry benchmarks such as TPC-H on a graph database.
Perhaps a minor drawback is that you don't use SQL for analytics -- instead using a SQL-like language such as SPARQL or Cypher. Traditional SQL is built on the old table schemas model and does not store relationship information the way a graph database does. This makes a different language necessary. With the new language, you get graph algorithms such as pagerank, shortest path, weakly connected components, and counting triangles -- to name a few.
Because so many data warehouses deal with customer information, the additional graph functions give you the power to identify influencers, identify patterns in a supply chain, find friend or spousal information, manage parent/child relationships in people and in companies, and so much more.
Graph databases have a powerful feature called inferencing that allows for inferred relationships. So, if Jane is married to Jack, you can infer that Jack is married to Jane. Only one of those relationships needs to be defined in order to perform analytics on it.
The Future of Machine Learning
Looking toward the future, graph databases just may become the preferred platform for machine learning. Data wrangling will be easier when you only have to manage triples. However, it's more than just data preparation.
Some new analytics approaches (such as deep learning and inferencing) are easier to support in a graph OLAP database. Algorithms such as pagerank, shortest path, and triangle counting are faster and less cumbersome in a graph database environment. The graph environment is perfect for performing principal component analysis (PCA) algorithms, which are used for everything from assessing risk in financial services companies to genomic research.
The last thing you want is a special-purpose database that does just one thing, and it's clear that a graph database is far more than that. More companies are looking to a best-of-breed approach in order to expand the breadth of analytics they offer.
About the Author
Steve Sarsfield is the VP of product for AnzoGraph, the core graph OLAP database from Cambridge Semantics. His experience in the industry includes former positions at IBM, Talend, and Vertica. Steve is also the author of the book The Data Governance Imperative, which discusses the topic of how business and IT can better work together to address business challenges.