
Data Stories: The New Normal
These data visualizations explore how rates of retail spending and air travel are shifting as COVID-19 case numbers fall.
- By Upside Staff
- June 16, 2021
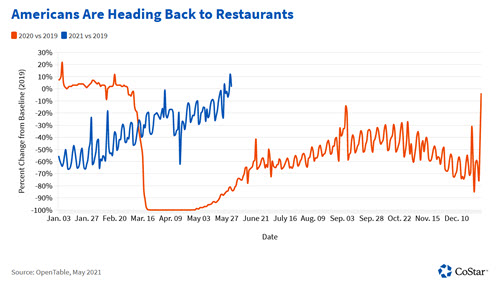
A set of charts created by commercial real estate group CoStar shows that people in the U.S. are increasing spending on restaurants, hotels, and travel -- and the U.S. inflation rate is changing.
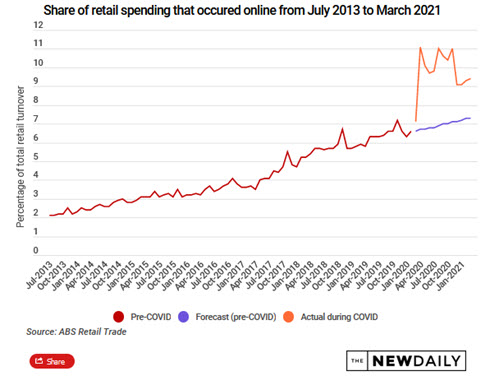
On the other hand, this article from Australian newspaper The New Daily suggests that many people are still staying in, as online shopping continues to be more popular than before the pandemic.
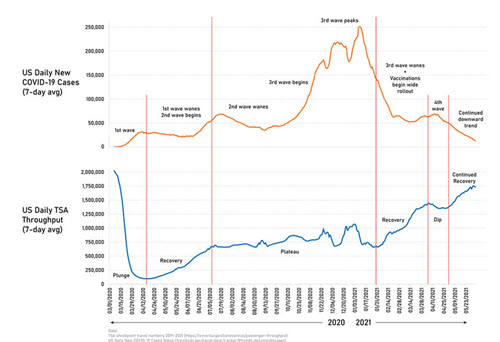
This chart from the Window Flyer compares the U.S. COVID-19 case numbers to the rates of air travel.