 Fern Halper, Ph.D., is vice president and senior director of TDWI Research for advanced analytics. She is well known in the analytics community, having been published hundreds of times on data mining and information technology over the past 20 years. Halper is also co-author of several Dummies books on cloud computing and big data. She focuses on advanced analytics, including predictive analytics, text and social media analysis, machine-learning, AI, cognitive computing and big data analytics approaches. She has been a partner at industry analyst firm Hurwitz & Associates and a lead data analyst for Bell Labs. Her Ph.D. is from Texas A&M University. You can reach her by email (fhalper@tdwi.org), on Twitter (twitter.com/fhalper), and on LinkedIn (linkedin.com/in/fbhalper).
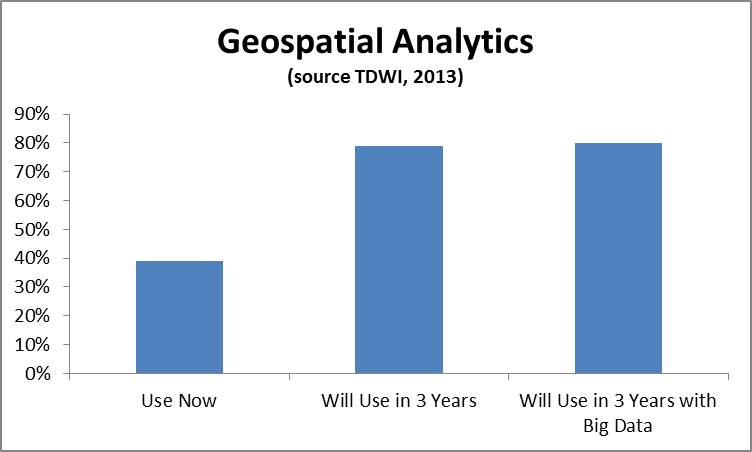
Geospatial data can be extremely powerful for a wide variety of use cases. Geospatial analysis – i.e. the practice of incorporating spatial characteristics in various kinds of analysis- has been incorporated in BI and visualization solutions for at least several years. Recently I’ve been hearing a lot from vendors about geospatial applications and using geospatial data in a range of more advanced analytics. In a recent TDWI technology survey, you can see that the geospatial analytics is growing in importance. We asked the respondents, “What kind of analytics are you currently using in your organization today to analyze data? In three years?” and “What kinds of techniques and tools is your organization using for big data analysis both today and in three years?” In the figure below, the 39% of respondents were currently using geospatial analysis and this number jumped to 79% in three years. The number of respondents answering affirmatively that geospatial analysis would be used in their big data solutions in three years was 81%.
Companies are becoming excited by the prospect of incorporating geospatial data into analysis. In terms of more advanced analytics, here are few examples of the kinds of analysis I’ve been hearing about:
- Predictive analytics. Geo-location data is being incorporated into predictive analytics. The most recent example of this is KXEN (www.kxen.com) announcing support for geo-location in its predictive analytics solution. KXEN will support data sources such as GPS, phone calls, machine sensors, geo-referenced signals, and social media. This includes capabilities for location-awareness, co-location, and path identification. For instance, marketers could use this kind of data to determine how likely someone is to purchase something at a store based on the path they took to get there (based on what others who took similar paths with a similar profile did) and offer a coupon based on this.
- Operational Intelligence. Operational intelligence incorporates analytics as part of a business process. Companies like Vitria (www.vitria.com) that provide operational intelligence solutions, support geospatial data. For instance, a wireless telephone company that monitors its network could use location data to determine which cell tower to fix based on where their high value customers are located.
- Situational Intelligence. Situational intelligence is a technique that integrates and correlates large volumes of multidimensional real time and historical data to identify and act on a problem. Part of that data is often geospatial For example, companies like Space Time Insight (www.spacetimeinsight.com) provide this kind of solution to help companies that deal with physical assets. Visualizing and analyzing this data can help answer questions like what happened, where did it happen, and why did it happen. Companies such as utility companies would use this information to a pinpoint problem and find the closest person to fix it.
I expect to hear a lot more about geospatial data and geospatial analysis moving forward. I’ll be writing more on the topic in the second half of 2013 and in 2014. Stay tuned.
Posted by Fern Halper, Ph.D. on July 1, 20130 comments
Predictive analytics, a technology that has been around for decades has gotten a lot of attention over the past few years, and for good reason. Companies understand that looking in the rear-view mirror is not enough to remain competitive in the current economy. Today, adoption of predictive analytics is increasing for a number of reasons including a better understanding of the value of the technology, the availability of compute power, and the expanding toolset to make it happen. In fact, in a recent TDWI survey at our Chicago World Conference earlier this month, more than 50% of the respondents said that they planned to use predictive analytics in their organization over the next three years. The techniques for predictive analytics are being used on both traditional data sets as well as on big data.
Here are five trends that I’m seeing in predictive analytics:
- Ease of use. Whereas in the past, statisticians used some sort of scripting language to build a predictive model, vendors are now making their software easier to use. This includes hiding the complexity of the model building process and the data preparation process via the user interface. This is not a new trend but it is worth mentioning because it opens up predictive analytics to a wider audience such as marketing. For example, vendors such as Pitney Bowes, Pegasystems, and KXEN provide solutions targeted to marketing professionals with ease of use as a primary feature. The caveat here, of course, is that marketers still need the skills and judgment to make sure the software is used properly.
- Text hits the mainstream in predictive analytics. The kind of data being used as part of the predictive analytics process continues to grow in scope. For example, some companies are routinely using text data to improve the lift of their predictive models because it helps provide the “why” behind the “what”. Predictive analytics providers such as IBM and SAS provide text analytics as part of their solution. Others, such as Angoss and Pegasystems have partnered with text analytics vendors (such as Lexalytics and Attensity) to integrate this functionality in their products.
- Geospatial data use is on the rise. Geospatial data is also becoming more popular for use in and with predictive analytics. For instance, geospatial predictive analytics is being used to predict crime and terrorism. On the business front, location based data is starting to be used in conjunction with predictive modeling to target specific offers to customers based on where they are (i.e. traveling from work, at home) and their behavior.
- Operationalizing the analytics for action. Operationalizing means making something part of a business process. For example, companies are using predictive analytics to predict maintenance failures, predict collections, predict churn, and the list goes on. In these examples, predictive models are actually incorporated into the business process of an organization. For example, if a customer takes a certain action that puts them at risk for churn, that customer’s information is routed to the appropriate department for action. In fact, the term “action” and “insight to action” has come up quite a bit in recent conversations I’ve had with vendors.
- Adaptive learning: I’ve heard this go by a number of names – adaptive intelligence, automated learning, and adaptive learning. The idea is about continuously learning. For example, a model to understand behavior might be deployed against customer data. As the data changes, the model might change too. This kind prediction could also work against streaming data. Adaptive intelligence is still pretty early in the adoption cycle, but I expect it to increase.
These are just a few of the trends that I’m seeing in predictive analytics. As the technology continues to be adopted, new trends will certainly emerge. I used predictive analytics back in the late 1980s when I was at AT&T to understand customer behavior and I’m very happy to see that it’s a technology whose time has finally come! I’m now starting work on TDWI’s Best Practices Report on Predictive Analytics. Expect more from me on this topic in the future.
Posted by Fern Halper, Ph.D. on May 22, 20130 comments
With all of the research I’ve been doing around cloud computing over the past few years, I’ve noticed something very disturbing about how people use the word premises. I’ve blogged about this before but it merits repeating on my TDWI blog. Maybe it’s because I come from a telecommunications background that this bothers me so much – but has anyone else noticed that people are misusing the words premise/premises when describing aspects of the cloud? The proper term is generally premises, people, as in – on your premises (see below).
From Dictionary.com
Premise: a proposition supporting or helping to support a conclusion, a statement considered to be true.
Premises: a tract of land including its buildings.
Therefore, when discussing where servers, services, etc. are located, for instance, you should use the term premises.
Even vendors in the space make this mistake and I cringe every time I hear it. I used to correct them, but I’ve given up doing that. I could list hundreds, if not thousands, of examples of this error. Has the definition of the word changed and I’m missing something? Or, has the word been used incorrectly so many times that it doesn’t matter anymore? My POV: It still matters.
Posted by Fern Halper, Ph.D. on April 17, 20130 comments
Last week I attended the IBM Big Data at the Speed of Business Event at IBM’s Research facility in Almaden. At the event IBM announced multiple capabilities around its big data initiative including its new BLU Acceleration and IBM PureData System for Hadoop. Additionally, new versions of Infosphere Big Insights and Infosphere Streams (for data streams) were announced as enhancements to IBM’s Big Data Platform. A new version of Informix that includes time series acceleration was also announced.
The overall goal of these products is to make big data more consumable –i.e. to make it simple to manage and analyze big data. For example, IBM PureData System for Hadoop is basically Hadoop as an appliance, making it easier to stand up and deploy. Executives at the event said that a recent customer had gotten its PureData System “loading and interrogating data 89 minutes.” The solution comes packaged with analytics and visualization technology too. BLU Acceleration combines a number of technologies including dynamic in-memory processing and active compression to make it 8-25x faster for reporting and analytics.
For me, some of the most interesting presentations focused on big data analytics. These included emerging patterns for big data analytics deployments, dealing with time series data, and the notion of the contextual enterprise.
Big data analytics use cases. IBM has identified five big data use cases from studying hundreds of engagements it has done across 15 different industries. These high value use cases include:
- 360 degree view of a customer- utilizing data from internal and external sources such as social chatter to understand behavior and “seminal psychometric markers” to gain insight into customer interactions.
- Security/Intelligence- utilizing data from sources like GPS devices and RFID tags and consuming it at a rate to protect individual safety from fraud or cyber attack.
- Optimizing infrastructure- utilizing machine generated data such as IT log data, web data, and asset tags to a improve service or monetize it.
- Data warehouse augmentation- extending the trusted data in a data warehouse by integrating other data with it like unstructured information.
- Exploration- visualizing and understanding more business data by unifying data across different silos to identify patterns or problems.
(for more information on these use cases there is a good podcast by Eric Sall)
Big data and time series. I was happy to see that Informix can handle time series data (it has been doing that for several years) and that the market is beginning to understand the value of time series data in big data analytics. According to IBM, this is being driven in part by the introduction of new technologies like RFID tags and smart meters. Think about a utility company collecting time series data from the smart meter on your house. This data can be analyzed not only to compute your bill, but to do more sophisticated analysis like predicting outages. Now, it will be faster to analyze this data because BLU Acceleration will be used with IBM Informix. This is a case of a new kind of data being analyzed using new technology.
The contextual enterprise. Michael Karasick, VP of IBM Research talked about the notion of the Contextual Enterprise which is a new holistic approach of dynamically building and accumulating context at scale from disparate data sources to deliver client value. These utilize data from what IBM calls systems of engagement (sources such as email, social data, media) together with traditional data sources in a gather, connect, reason, and adapt loop.
There is definitely a lot to wrap your head around in these big data announcements. The bottom line though is that the goal of these new products is to provide ease of use and improvements in performance and capabilities which can help improve big data analytics. The products can help improve what companies have already been doing with analytics because it is now faster to do it or they can help companies to perform new kinds of analysis that they couldn’t do before. That is what big data analytics is about.
Posted by Fern Halper, Ph.D. on April 8, 20130 comments
I’ve recently spent a lot of time talking to companies about how they’re using text analytics. By far, one of the biggest use cases for text analytics centers on understanding customer feedback and behavior. Some companies are using internal data such as call center notes or emails or survey verbatim to gather feedback and understand behavior, others are using social media, and still others are using both.
What are these end users saying about how to be successful with text analytics? Aside from the important best practices around defining the right problem, getting the right people, and dealing with infrastructure issues, I’ve also heard the following:
Best Practice #1 - Managing expectations among senior leadership. A number of the end-users I speak with say that their management often thinks that text analytics solutions will work almost out of the box and this can establish unrealistic expectations. Some of these executives seem to envision a big funnel where reams of unstructured text enter and concepts, themes, entities, and insights pop out at the other end. Managing expectations is a balancing act. On the one hand, executive management may not want to hear the details about how long it is going to take you to build a taxonomy or integrate data. On the other hand, it is important to get wins under your belt quickly to establish credibility in the technology because no one wants to wait years to see some results. That said, it is still important to establish a reasonable set of goals and prioritize them and to communicate them to everyone. End users find that getting senior management involved and keeping them informed with well-defined plans on a realistic first project can be very helpful in handling expectations.
Best Practice #2 – Manage expectations among business analysts (and statisticians). Most people who deal with text analysis believe that “looking at text data is very different than analyzing structured data.” It turns out that some analysts get uncomfortable when dealing with unstructured data because they’re used to building models with extremely high accuracy using well-understood structured data. The reality is that with unstructured text, you might only achieve 70-80 percent accuracy (for example, in sentiment analysis). Therefore, these analysts need to enter into the analysis with their eyes open to this ambiguity and decide what they can live with in terms of analysis. End-users I’ve spoken to say that this can take a little time and patience, but with some education, it does work.
Best Practice #3- Keep it visible. I have spoken with a number of companies that understand that in order for text analytics to keep a seat at the (executive) table it is important to keep it front and center. How do they do this? Some companies distribute ongoing analysis while others distribute daily customer quotes from unstructured data sources. Many find that the emotion and feeling in customer feedback can really capture the attention of senior leadership. Other end-users have cited the ability to “tell the story” with your text data, and that story can be very powerful and provide visibility to the analysis.
Best Practice #4 -Dig, Dig, Dig. Dig deeper than just monitoring. Many companies start off with social media analysis as the first part of their text analytics journey. However, many social media analytics platforms are nothing more than listening posts that will give you some hint as to the buzz around your product and if it is positive or negative. At the end of the day, that doesn’t provide you with much information. They may be a good first step in getting your feet wet. However, companies that are successful in utilizing text analytics tools believe that they are just touching the tip of the iceberg in the kinds of analysis they can perform with a text analytics tool. They are integrating data sources (i.e. structured and unstructured) and digging deep into the data to determine the why around the what of certain issues. This means visualizing the data as well as utilizing more sophisticated methods to analyze it.
Best Practice # 5- Actionable feedback requires a way to take action. Text analytics can provide you with significant insight as to the “why” of a behavior. However, you need to be in a position to make it actionable if you want to derive the most benefits from the technology. For instance, you may determine that a group of customers are unhappy about a certain product or that a feature you provide isn’t meeting expectations and that is why they are no longer customers. That’s great insight, but you need to be able to act on it. Of course, action can come in a number of flavors. It can be as simple as having a manual process in place to deal with the insights. Or it can become more sophisticated. For example, some are operationalizing a process by using tools that help to close the loop with their customers by routing comments to agents who can then reach out to these customers.
Of course, many of these best practices are useful for any kind of advanced analytics. However, as text data takes its place in organizations, it is essential not to forget them. It is also important to remember that there are differences between analyzing and utilizing structured and unstructured data – a topic I will explore further in future posts.
Posted by Fern Halper, Ph.D. on February 14, 20130 comments
I am excited to join TDWI as the Research Director for Advanced Analytics. Of course, different people have different definitions for advanced analytics. Here’s how I define it. Advanced analytics provides algorithms for complex analysis of either structured or unstructured data. It includes sophisticated statistical models, machine learning, neural networks, text analytics and other advanced data mining techniques. Among its many use cases, it can be deployed to find patterns in data, prediction, optimization, forecasting, and stream mining. It typically does not include simple database query and reporting or OLAP cubes.
Clearly, big data and advanced analytics are becoming increasingly interconnected. The development of big data analytics has been driven by scientific research, the needs of Internet giants, and the requirements of large multi-national companies. However, more and more, organizations are realizing that big data -- both in-house, or that they can obtain from external sources -- might provide very valuable insight. Until recently, though, it was difficult to glean insight from this data because of cost, infrastructure, algorithmic, and other issues.
Many companies are interested in big data analytics but don’t know where to start. Others are early in their big data deployments and want to understand what they should be doing next. Therefore, one of the first projects I’m working on at TDWI is a Big Data Analytics Maturity Model. The maturity framework is divided into five categories, each with a series of subcategories and questions associated with those subcategories. For example, one category examines how organizational factors such as strategy, leadership, skills, funding, and culture play into your maturity in terms of big data analytics. Other categories examine factors related to infrastructure, data, analytics, and governance. All of this is related to best practices.
Since I just finished co-authoring Big Data for Dummies, this is a great project for me as I begin my career at TDWI. Please stay tuned!
Any thoughts, please let me know!
Posted by Fern Halper, Ph.D. on February 6, 20130 comments