TDWI just released my newest Checklist Report, Seven Considerations for Navigating Big Data Cloud Services. The report examines what enterprises should think about when evaluating the use of public cloud services to manage their big data. The cloud can play an important role in the big data world since horizontally expandable and optimized infrastructure can support the practical implementation of big data. In fact, there are a number of characteristics that make the cloud a fit for the big data ecosystem. Four of these include:
- Scalability. Scalability with regard to hardware refers to the ability to go from small to large amounts of processing power with the same architecture. The cloud can scale to large data volumes. Distributed computing, an integral part of the cloud model, works on a “divide and conquer” plan. So if you have huge volumes of data, they can be partitioned across cloud servers.
- Elasticity. Elasticity refers to the ability to expand or shrink computing resource demand in real time, based on need. This means that you have the potential to access as much of a service when you need it. This can be helpful for big data projects where you might need to expand the amount of computing resources you need to deal with the volume and velocity of the data.
- Resource pooling. Cloud architectures enable the efficient creation of groups of shared resources that make the cloud economically viable.
- Self-service. This refers to the ability of a user to run a set of cloud resources via a portal or browser interface. This is different than requesting it from your IT department.
For instance, you might want to use a public cloud to run your real-time predictive model against high volumes of data because you don’t want to use your own physical infrastructure to do so. Additionally, some companies are using the public cloud to explore big data, and then move certain information to the data warehouse. In effect, the cloud extends the data warehouse. There are numerous use cases emerging for big data in the cloud.
TDWI is starting to see an uptick in interest in the public cloud for BI and analytics. For example, in our recent quick survey of users who attended our Las Vegas World Conference, only about 25% of respondents said they would never use the public cloud for BI or analytics. The rest were either currently using the cloud (about 18%) or were actively looking into it or considering it as a possibility. We saw a similar response in a quick survey we did at our Boston conference in the fall of 2013. This will be an active area of research for TDWI this year, so stay tuned!
For more on big data in the cloud, also refer to Big Data for Dummies.
Posted by Fern Halper, Ph.D. on March 3, 20140 comments
My new (and first!) TDWI Best Practices Report was published a few weeks ago. It is called Predictive Analytics for Business Advantage. In it, I use the results from an online survey together with some qualitative interviews to discuss the state of predictive analytics, where it is going, and some best practices to get there. You can find the report here. The Webinar on the topic can be found here.
There were many great questions during the Webinar and I’m sorry I didn’t get to answer them all. Interestingly, many of the questions were not about the technology; rather they were about how to convince the organization (and the senior executives) about the value in predictive analytics. This jives with what I saw in my research. For instance,”lack of understanding of predictive analytics” was cited as a key challenge for the discipline. Additionally, when we asked the question, “Where would you like to see improvements in your predictive analytics deployment?”, 70% of all respondents answered “education.” It’s not just about education regarding the technology. As one respondent said, “There is a lack of understanding of the business potential” for predictive analytics, as well.
Some of the questions from the audience during the Webinar echoed this sentiment. For instance, people asked, “How do I convince senior execs to utilize predictive analytics?” and “What’s the simple way to drive predictive analytics to senior executives?” and “How do we get key leaders to sponsor predictive analytics?”
There is really no silver bullet, but here are some ways to get started:
- Cite research: One way is to point to studies that have been done that quantify the value. For instance, in the Best Practices Report, 45% of the respondents who were currently using predictive analytics actually measured top- or bottom-line impact or both (see Figure 7 in the report). That’s pretty impressive. There are other studies out there as well. For instance, academic studies (i.e., Brynjolffson et al., 2011) point to the relationship between using data to make decisions and improved corporate performance. Industry studies by companies such as IBM suggest the same. Vendors also publish case studies, typically by industry, that highlight the value from certain technologies. These can all be useful fodder.
- Do a proof of concept: However, these can’t really stand alone. Many of the end users I spoke to regarding predictive analytics all pointed to doing some sort of proof of concept or proof of value project. These are generally small-scale projects with high business impact. The key is that there is a way to evaluate the impact of the project so you can show measurable results to your organization. As one respondent put it, “Limit what you do but make sure it has an impact.” Additionally, think through those metrics as you’re planning the proof of concept. Additionally, someone in the organization is also going to have to become the communicator/evangelist to get people in the organization excited rather than fearful of the technology. One person told me that he made appointments with executives to talk to them about predictive analytics and show them what it could do.
- BI foundation: Typically, organizations that are doing predictive analytics have some sort of solid BI infrastructure in place. They can build on that. For instance, one end user told me about how he built out trust and relationships by first establishing a solid BI foundation and making people comfortable with that and then introducing predictive analytics. Additionally, success breeds success. I’ve seen this countless times with various “new” technologies. Once one part of the organization sees something that works, they want it too. It grows from there.
- Grow it by acting on it: As one survey respondent put it, “Analytics is not a magic pill if the business process is not set up.” That means in order to grow and sustain an analytics effort, you need to be able to act on the analytics. Analytics in a vacuum doesn’t get you anywhere. So, another way to show value is to make it part of a business process. That means getting a number of people in the organization involved too.
The bottom line is that it is a rare company that can introduce predictive analytics, and behold! It succeeds quickly out of the gate. Are there examples? Sure. Is it the norm? Not really. Is predictive analytics still worth doing? Absolutely!
Do you have any suggestions about how to get executives and other members of your organization to value predictive analytics? Please let me know.
Posted by Fern Halper, Ph.D. on January 20, 20140 comments
The Big Data Maturity Model and Assessment is set to launch on November 20th. Krish Krishnan and I have been working on this for a while, and we’re very excited about it.
As I mentioned in my previous blog post (see previous post, below), there are two parts to the Big Data Maturity Model and assessment tool. TDWI members will be getting an email about the assessment on November 20th. We urge you to take the assessment and see where you land relative to your peers regarding your big data efforts. Additionally, it’s important to note that we view this assessment as evolutionary. We know that many companies are in the early stages of their big data journey. Therefore, this assessment is meant to be evolutionary. You can come back and take it more than once. In addition, we will be adding best practices as we learn more about what companies are doing to succeed in their big data efforts.
In the course of our research for the model, Krish and I spoke to numerous companies embarking on big data. There were some patterns that emerged regarding how companies get started in their big data efforts. Here are a few of them:
- Large volumes of structured data are already being analyzed in the company. Some companies have amassed large volumes (i.e., terabytes) of structured data that they are storing in their data warehouse or in some sort of appliance, often on-premises. They feel that their BI infrastructure is pretty solid. Typically, the BI effort is departmental in scope. Some of these companies are already performing more advanced kinds of analysis; such as predictive analytics on the data. Often, they are doing this to understand their customers. The vision for big data is about augmenting the data they have with other forms of data (often text or geospatial data) to gain more insight.
- A specific need for big data. Some companies start a big data effort, almost from scratch, because of a specific business need. For instance, a wireless provider might be interested in monitoring the network and then predicting where failures will occur. An insurance company might be interested in telemetric information in order to determine pricing for certain kinds of drivers. A marketing department might be interested in analyzing social media data to determine brand reputation or as part of a marketing campaign. Typically these efforts are departmental in scope and are not part of a wider enterprise big data ecosystem.
- Building the business on big data. We spoke to many e-businesses that were building the business model on big data. While these companies might be somewhat advanced in terms of infrastructure to support big data often they were still working on the analytics related to the service and typically did not have any form of governance in place.
Remember to check your email!
Posted by Fern Halper, Ph.D. on November 18, 20130 comments
We are getting ready to launch the TDWI Big Data Maturity Model and assessment tool in the next few weeks. We’re very excited about it, as it has taken a number of months and a lot of work to develop. There are two parts to the Big Data Maturity Model and assessment tool. The first is the actual TDWI Big Data Maturity Model Guide. This is a guide that walks you through the actual stages of maturity for big data initiatives and provides examples and characteristics of companies at different stages of maturity. In each of these stages, we look across various dimensions that are necessary for maturity. These include organizational issues, infrastructure, data management, analytics, and governance.
The second piece is the assessment tool. The tool allows respondents to answer a series of about 50 questions in the organization, infrastructure, data management, analytics, and governance dimensions. Once complete, the respondent receives a score in each dimension as well as some expectations and best practices for moving forward. A unique feature of the assessment is that respondents can actually look to see how their scores compare against their peers, by both industry and company size.
At the same time we’ve been building the Big Data Maturity Model, I’ve also been working on the predictive analytics Best Practices Report. Since no survey about analytics would be complete without some questions about big data, I did include a section about it in the survey. Interestingly, over 70% of the respondents actively using predictive analytics or planning to use it (242 respondents) from the survey claim to have some sort of big data push going on in their organization.
The group also reported a series a challenges (seen in the figure, below).
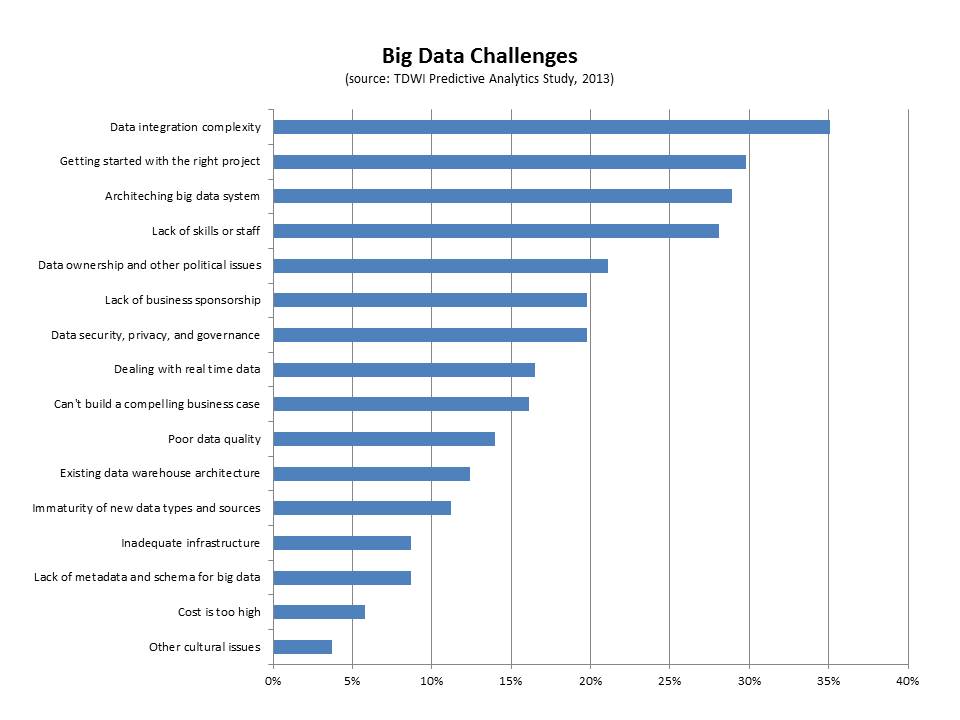
- Data integration. The top challenge cited by this group of respondents was big data integration (35%). Interestingly, if you look only at those respondents who are current users of predictive analytics and users of big data, 44% report this as the top challenge. Clearly, integrating disparate kinds of data from different sources is difficult. We saw this in our interviews for the big data maturity model. For instance, despite having some sort of data warehouse (especially in the case of the enterprise), a nascent organization in terms of big data maturity will often have also collected data as files with different formats, but without naming standards, and with storage structures that are minimally defined. This data is not integrated.
- Getting started with the right project. This is a key challenge that companies face when getting started with big data. Thirty percent of the respondents in this group cited it as a top challenge. We note this in the maturity model as well as a pre-adoption issue. Typically, there might be a team charged with exploring big data that is trying to determine the top business problems to solve. Identifying the right business problem is critical for success and business needs to get involved as quickly as possible.
- Architecting a big data system. Big data can mean disparate kinds of high-volume and high-frequency data. Architecting a system is important for success and it can be difficult. Twenty-nine percent of the respondents cited this as a challenge. The end goal for an architecture is frequently some sort of big data ecosystem that contains a unified information architecture which underpins analytics. Getting there can involve surgical precision in terms of rolling out infrastructure.
- Lack of skills or staff. Twenty-eight percent of respondents cited this as a top challenge. This is a key challenge, whether it is the skills for Hadoop or other big data infrastructure or the analytics skills required to make sense of big data. Different organizations approach the skills issue in different ways. Some hire externally or look for university hires. Others try to re-train from within. Still others look to cross-pollinate skills from one part of the organization to a team that utilizes new technologies. Some build centers of excellence that help with the training from within. Others form SWOT-type teams to address big data analytics.
Look out for e-mails and other materials over the next few weeks letting you know that the Big Data Maturity Model and assessment tool are live!
Posted by Fern Halper, Ph.D. on October 29, 20130 comments
As I mentioned in my last blog post, I am in the process of gathering survey data for the TDWI Best Practices Report about predictive analytics. Right now, I'm in the data analysis phase. It turns out (not surprisingly) that one of the biggest barriers to adoption of predictive analytics is understanding how the technology works. Education is definitely needed as more advanced forms of analytics move out to less experienced users.
With regard to education, coincidentally I had the pleasure of speaking to Eric Siegel recently about his book, Predictive Analytics: The Power to Predict Who Will Click, Buy, Lie, or Die (www.thepredictionbook.com). Eric Siegel is well known in analytics circles. For those who haven’t read the book, it is a good read. It is business focused with some great examples of how predictive analytics is being used today.
Eric and I focused our discussion on one of the more technical chapters in the book that addresses the problem known as overfitting (aka overlearning)—an important concept in predictive analytics. Overfitting occurs when a model describes the noise or random error rather than the underlying relationship. In other words, it occurs when your data fits the model a little too well. As Eric put it, "Not understanding overfitting in predictive analytics is like driving a car without learning where the brake pedal is."
While all predictive modeling methods can overlearn, a decision tree is a good technique for intuitively seeing where overlearning can happen. The decision tree is one of the most popular types of predictive analytics techniques used today. This is because it is relatively easy to understand—even by the non-statistician—and ease of use is a top priority among end users and vendors alike.
Here's a simplified example of a decision tree. Let's say that you're a financial institution that is trying to understand the characteristics of customers who leave (i.e., defect or cancel). This means that your target variables are leave (yes) and don't leave (no). After (hopefully) visualizing or running some descriptive stats to get a sense of the data, and understanding the question being asked, the company puts together what's called a training set of data into a decision tree program. The training set is a subset of the overall data set in terms of number of observations. In this case it might consist of attributes like demographic and personal information about the customer, size of monthly deposits, how long the customer has been with the bank, how long the customer has used online banking, how often they contact the call center, and so on.
Here's what might come out:

The first node of the decision tree is total deposit/month. This decision tree is saying that if a customer deposits more than $4K per month and is using online bill pay for more than two years, they are not likely to leave (there would be probabilities associated with this). However, if they have used online banking for less than two years and contacted the call center X times, there may be a different outcome. This makes sense intuitively. A customer who has been with the bank a long time and is already doing a lot of online bill paying might not want to leave. Conversely, a customer who isn't doing a lot of deposits and who has made a lot of calls to the call center might be having trouble with the online bill pay. You can see that the tree could branch down and down, each branch with a different probability of an outcome, either yes or no.
Now, here's the point about overfitting. You can imagine that this decision tree could branch out bigger and bigger to a point where it could account for every case in the training data, including the noisy ones. For instance, a rule with a 97% probability might read, "If customer deposits more than $4K a month and has used online bill pay for more than two years, and lives in ZYX, and is greater than 6 feet tall, then they will leave." As Eric states in his book, "Overlearning is the pitfall of mistaking noise for information, assuming too much about what has been shown in the data." If you give the decision tree enough variables, there are going to be spurious predictions.
The way to detect the potential pitfall of overlearning is apply a set of test data to the model. The test data set is a "hold out"; sample. The idea is to see how well the rules perform with this new data. In the example above, there is a high probability that the spurious rule above won't pan out in the test set.
In practice, some software packages will do this work for you. They will automatically hold out the test sample before supplying you with the results. The tools will show you the results on the test data. However, not all do, so it is important to understand this principle. If you validate your model using hold-out data, then overfitting does not have to be a problem.
I want to mention one other point here about noisy data. With all the discussion in the media about big data, there has been a lot said about people being misled by noisy big data. As Eric notes, "If you checking 500K variables you'll have bad luck eventually—you'll find something spurious." However, chances are that this kind of misleading noise is from an individual correlation, not a model. There is a big difference. People tend to equate predictive analytics with big data analytics. The two are not synonymous.
Are there issues with any technique? Of course. That's why education is so important. However, there is a great deal to be gained from predictive analytics models, as more and more companies are discovering.
Posted by Fern Halper, Ph.D. on September 11, 20130 comments
I am in the process of collecting data for my TDWI Best Practices Report on predictive analytics. The report will look at trends and best practices for predictive analytics. Some specific issues being investigated in the survey include: Who is using predictive analytics? What skills are needed for it? Is it being used in big data analysis? Is it being used in the cloud? What kind of data is being used for predictive analytics? What infrastructure is supporting it? What is the value that people using it are getting from it? The survey is slated to run another week, so if you haven’t had the chance to take it yet, please do. Here is the link:
I define predictive analytics as a statistical or data mining solution consisting of algorithms and techniques that can be used on both structured or unstructured data (together or individually) to determine future outcomes. It can be deployed for prediction, optimization, forecasting, simulation, and many other uses.
One of the first questions I ask in the survey is, “What is the status of predictive analytics in your organization?” To date, 37% of the respondents are currently utilizing predictive analytics, 53% are exploring it, and less than 10% have no plans to use it. Please note that this survey is not meant to determine the adoption of predictive analytics. The group who answered the survey might have been self-selecting in that those who are not using predictive analytics may have chosen not to respond to the survey, at all. One reason I asked this question was to be able to look at any differences between the two groups.
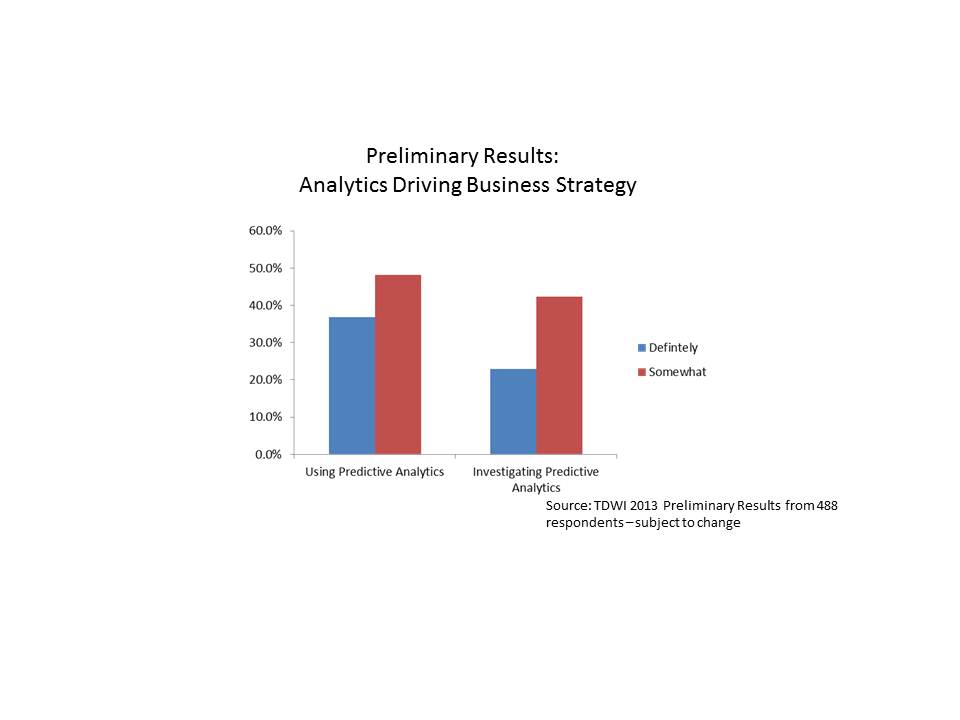
We asked the following question: “Would you say that analytics underpins your organization’s business strategy and drives day-to-day decisions?” The preliminary breakdown of responses is shown below.
Interestingly, those respondents who are already using predictive analytics were more likely to respond that analytics (in general) underpins their organization’s strategy and drives day-to-day decisions. About 37% of those respondents who are already using predictive analytics stated that analytics definitely underpins their day-to-day decision making, while only about 23% of those investigating the technology stated the same. Another way of looking at it is that 85% of those respondents using predictive analytics state that analytics is driving their day-to-day decisions in some way (i.e., answered definitely or somewhat), while only 65% of those who are investigating use analytics to drive day-to-day decisions and strategy.
Does this use of predictive analytics to drive strategy and decisions provide a benefit? It would appear so from preliminary results of the survey (of course subject to change). Close to 50% of the respondents who now use predictive analytics have actually measured a top or bottom line benefit or both from their predictive analytics efforts.
These preliminary results are quite interesting and I’m looking forward to getting all the data and analyzing the results! The TDWI Best Practices Report will be published later this year. I will continue to provide some updates here, along the way. So, stay tuned!
Posted by Fern Halper, Ph.D. on August 12, 20130 comments